|
The general format of the prediction results first a prediction of the next day high, low, and closing price. These results are all experimental, so they are prone to high error and low confidence. The predictions will also be accompanied with a candlestick chart where the last bar in the chart shows the predicted high, low, and closing price, and the other bars show the recent actual values. An example chart is shown below. 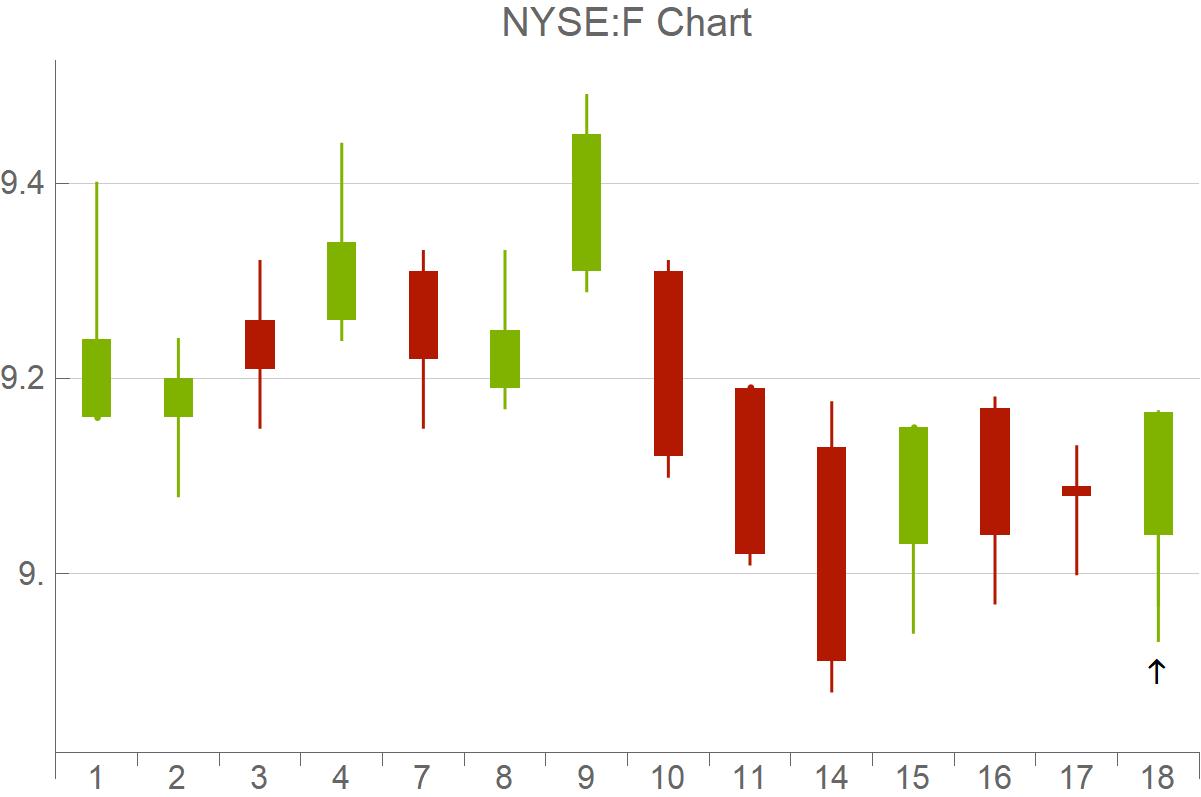
1 Comment
|
AuthorNathan Haut is a Ph.D. student studying machine learning and its applications in math, science, and engineering. He also has a strong interest in investing and actively invests as a hobby. Archives
August 2022
Categories |
 RSS Feed
